SBSPS-Challenge-1399-Sentiment-Analysis-of-COVID-19-Tweets-Visualization-Dashboard
Problem Statement
The sentiment analysis of Indians after the extension of lockdown announcements to be analyzed with the relevant #tags on twitter and build a predictive analytics model to understand the behavior of people if the lockdown is further extended. Also develop a dashboard with visualization of people reaction to the govt announcements on lockdown extension
Proposed Solution
Inorder to solve above problem, We have build predictive system to understand the sentiments of people from Live Tweets. For building the model we have used sentiment140 dataset. It contains 1,600,000 tweets extracted using the Twitter API. The tweets have been annotated (-1 = negative, 0 = neutral, 1 = positive)
According to the creators of the dataset: ‘‘Our approach was unique because our training data was automatically created, as opposed to having humans manual annotate tweets. In our approach, we assume that any tweet with positive emoticons, like :), were positive, and tweets with negative emoticons, like :(, were negative. We used the Twitter Search API to collect these tweets by using keyword search’’
So, with the help of visualization of these Live sentiments we get prior notice of increasing negative sentiments curve.
Flow diagram
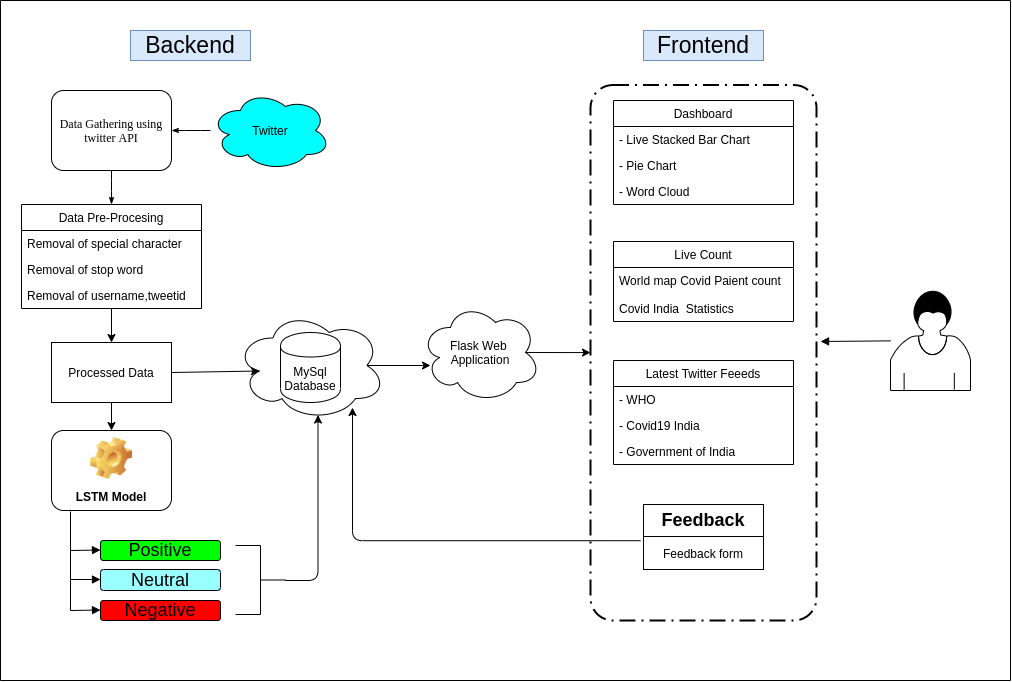
Technology Stack
Front End: HTML, CSS & JavaScript
Back End : MySql DB, Tensorflow 2.2
Usage
-
Download repository & locate it
$ git clone https://github.com/SmartPracticeschool/SBSPS-Challenge-1399-Sentiment-Analysis-of-COVID-19-Tweets-Visualization-Dashboard.git $ cd SBSPS-Challenge-1399-Sentiment-Analysis-of-COVID-19-Tweets-Visualization-Dashboard -
Make required required configuration
- Create virtualenv and activate it
$ # Virtualenv modules installation (Unix based systems) $ virtualenv env $ source env/bin/activate $ $ $ # Virtualenv modules installation (Windows based systems) $ # virtualenv env $ # .\env\Scripts\activate $ $ $ cd "Backed Model" $ pip install requirements.txt $ $ cd .. $ cd FrontEnd UI $ pip install requirements.txt $ #run flask server $ python run.py - Open
localhost:5000on chrome and Visualize data in real time.
Screenshots

Click Here to see more screenshots